Research summary · working paper, draft 3.2, November 2026

Cheaper goods, thinner budgets

If automation pushed unemployment to 20%, could lower prices and a tax-financed benefit preserve the consumption of the workers who lost their jobs? Under what conditions?

Short answer: yes in most cases, but only if automation raises output enough and the government can tax profits when public debt reaches its cap. In the central specification, a benefit that tops the displaced up to their pre-automation income, financed by a profit levy of up to 15% once the debt cap binds, keeps them at 90% or more of their consumption in 277 of 432 cases (64%), against 211 (49%) when the government can only cut the benefit. Making the levy costly shrinks this advantage and, in some specifications, trades it for more fiscal crises. And even when their consumption is preserved, the displaced fall behind those who keep their jobs unless part of the benefit is indexed to wages.

This is a stylised accounting model with a partial calibration to Israel, plus a descriptive look at the data. It describes conditions and mechanisms. It is not a forecast.
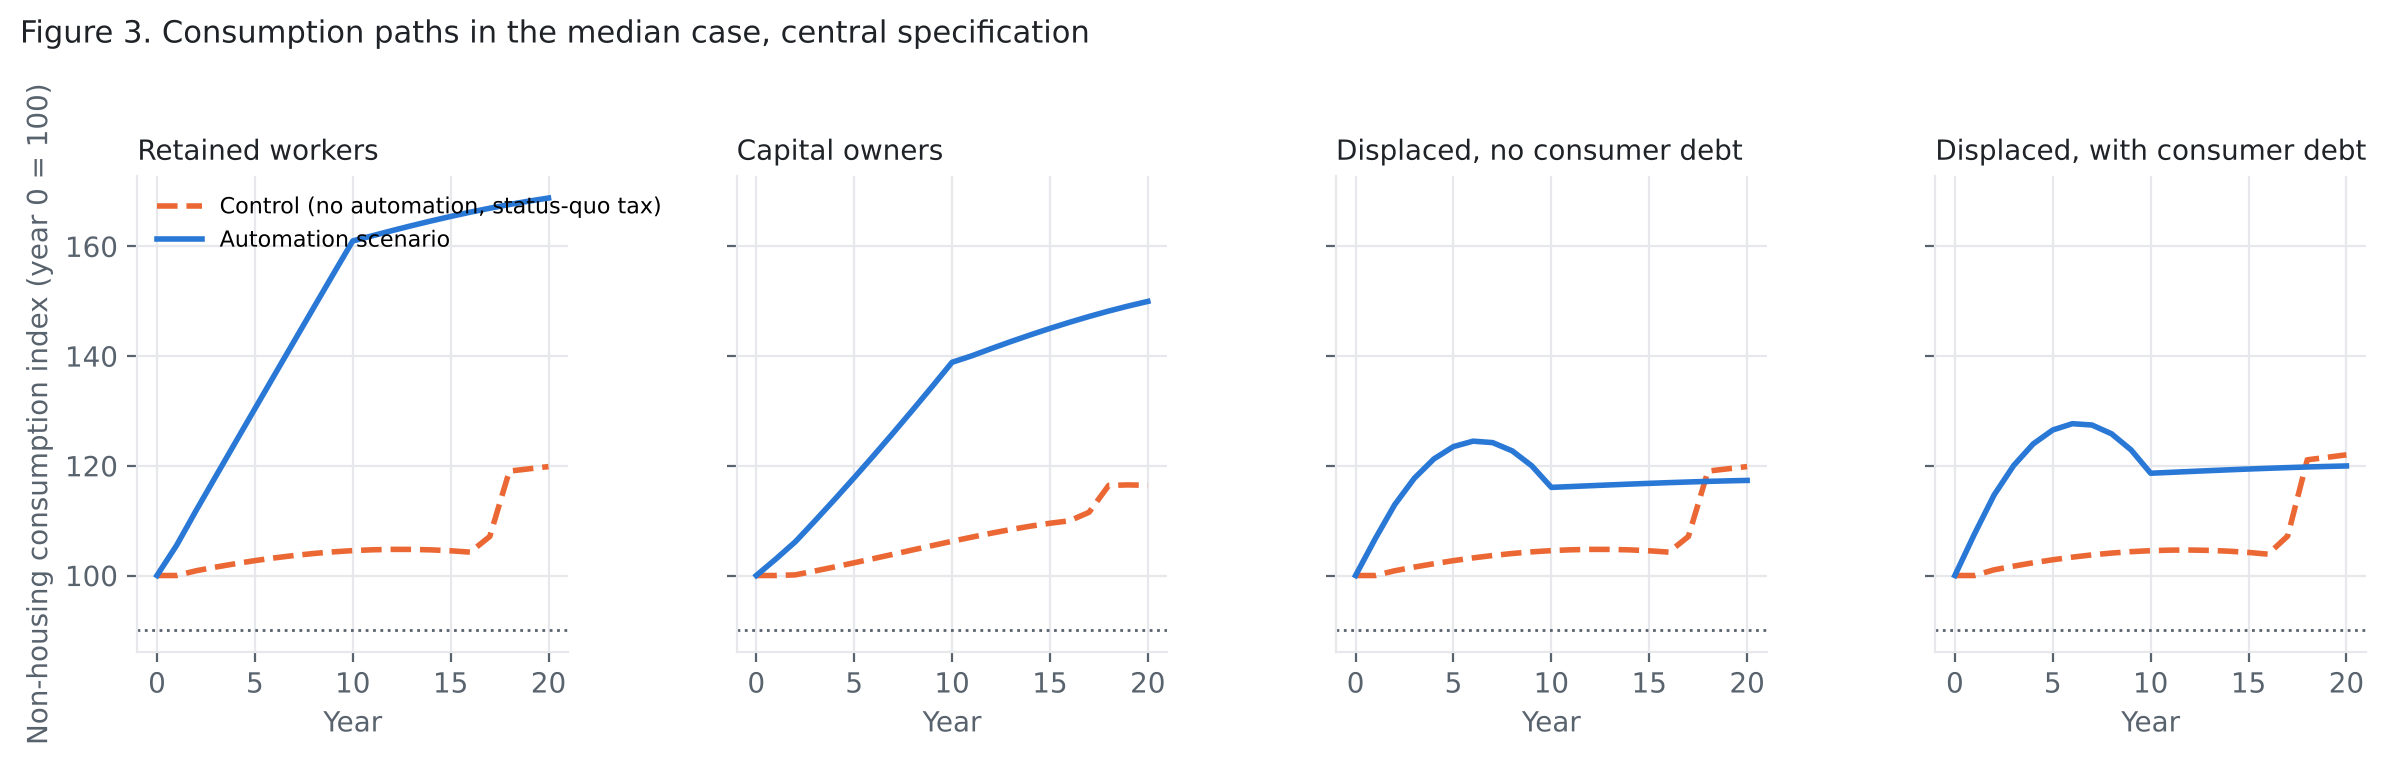
Consumption paths against the control in the central specification of step 281
Figure 3 · Median consumption paths by gap to the control, central specification (step 281).

How much productivity, and how much levy, does it take?

Each point is the median productivity gain g* at which both displaced groups keep 90% of their consumption, for a given ceiling on the profit levy. To the right of the line the median combination of assumptions is preserved; to the left it is not. The bars show the quartiles across 144 combinations of the other assumptions.

Breakeven productivity gain by levy ceiling: median and quartiles of 144 combinations, central specification. In the levy rows equity is priced at present value. Sources: research steps 277, 301, 304 and 305.
The figure as a table
Breakeven productivity gain g*: median (quartiles)
Rule when debt reaches the capCostless levyLevy with step-301 costsErosion elasticity 0.9
No levy (benefit cut, equity at present value)0.463 (0.344–0.625)0.338 (0.175–0.500)0.463 (0.344–0.625)
Levy up to 15% (central)0.325 (0.200–0.450)0.250 (0.125–0.325)0.375 (0.275–0.506)
Levy up to 30%0.200 (0.125–0.300)0.150 (0.100–0.200)0.350 (0.275–0.425)
Benefits only0.500 (0.350–0.675)0.350 (0.175–0.525)0.500 (0.350–0.675)

The step-301 costs are tax-base erosion with elasticity 0.5, owners who consume 0.4 of their income instead of 0.9, and equity priced after the levy. With these costs every threshold falls, even without a levy, so the comparison that matters is between the levy rows and the benefits-only row. An erosion elasticity of 0.9 is above published estimates (about 0.2 for the United States and 0.5–0.6 for Germany); there the levy lowers the threshold less, but at a 15% ceiling it still preserves 246 of 432 cases against 214 with no levy, with 37 fiscal crises instead of 110.

g is not total factor productivity. It is the efficiency gain in a scenario that also displaces 20% of workers: at g ≈ 0.38, output in year 20 equals output in the economy without automation. Data: frontier_web.json · step 305 note.

Three findings

277 / 432

Preservation is conditional

With a levy of up to 15% of profits before the benefit is cut, the displaced keep 90% of their consumption in 64% of cases, with no severe fiscal crisis; with benefit cuts alone, 49%. A 30% ceiling raises this to 78%. The result assumes that firms keep investing: if investment falls with unemployment, preservation ranges down to 35%, and to 11% in a stress case calibrated to OECD investment data (30% with an interest-rate rule bounded at zero).

g* = 0.33

The productivity needed depends on the tax

Under benefit cuts alone, the median case needs automation that leaves output about 21% above the economy without automation (g* = 0.50). With a levy of up to 15% and equity priced at present value, output about 9% below it is enough. This comparison changes both the levy and equity pricing. Giving the levy costs narrows its advantage, which disappears only at a tax-base erosion elasticity of about 2.4, roughly four times the upper end of published estimates.

+29% vs +3%

The displaced still fall behind

In the median case the displaced end close to where they would have been without automation (+3% to +4% of consumption), while retained workers gain about 29%. Both displaced groups end below the no-automation control in 47% of cases. Indexing half of the benefit to the wages of the employed, with a floor, closes that gap, at a benefit cost of 5.6% of output instead of 3.9%.

On the empirical side, firm AI adoption in 13 European countries (848 observations) shows no robust association with employment in exposed occupations (β = −0.55, p = 0.39), and in 50 European industries about 0.6 of a fall in unit labour cost reaches relative prices within a year and about 1 within five years, an estimate that may be biased upwards. Neither is a causal estimate.

What the model is, and what it is not

It is

  • A closed-accounting simulation: every payment is someone's receipt, so money is conserved in every run. There are four household groups (retained workers, capital owners, and two displaced groups, one with consumer debt), firms and a government, over 20 years with a 10-year transition.
  • A grid of 432 distinct cases crossing pass-through to prices, the productivity gain, profit taxation, ownership, housing tenure and interest-rate stress, plus a continuous sweep of the productivity gain.
  • Partly calibrated to Israel: base-year national accounts, household spending and housing tenure from the Central Bureau of Statistics.
  • Tested step by step: each extension (demand, investment, a central bank, levy costs, wages, indexation) is a documented research step with its data.

It is not

  • A forecast. The 20% unemployment path is assumed, and the grid is chosen by the researcher, so counts of cases are not probabilities.
  • A causal or estimated model of behaviour. Saving, investment, the levy and the fiscal rules follow stated rules; the empirical checks are descriptive.
  • A measure of total welfare. Consumption excludes housing, and preservation means keeping 90% of the pre-automation level in every year, a research choice.
  • Peer reviewed. See the disclosure below.

The full study (in Hebrew, with translated pages) → · Research log →

Paper and how to cite

Parnas, I. (2026). Cheaper Goods, Thinner Budgets: Can Lower Prices and Tax-Financed Benefits Protect Workers Displaced by Automation? (Version 3.1). Zenodo. https://doi.org/10.5281/zenodo.24134846

About this research

MacroVision is independent research by Ido Parnas, with no institutional affiliation and no supervisor. The text was revised after three rounds of informal review based on referee-style reports produced with AI tools. That review is not peer review, and the paper has not yet been peer reviewed.

Comments, corrections and press enquiries: idopar@gmail.com. Nothing on this site is investment or financial advice.