75 / 202
Consumption preservation is conditional
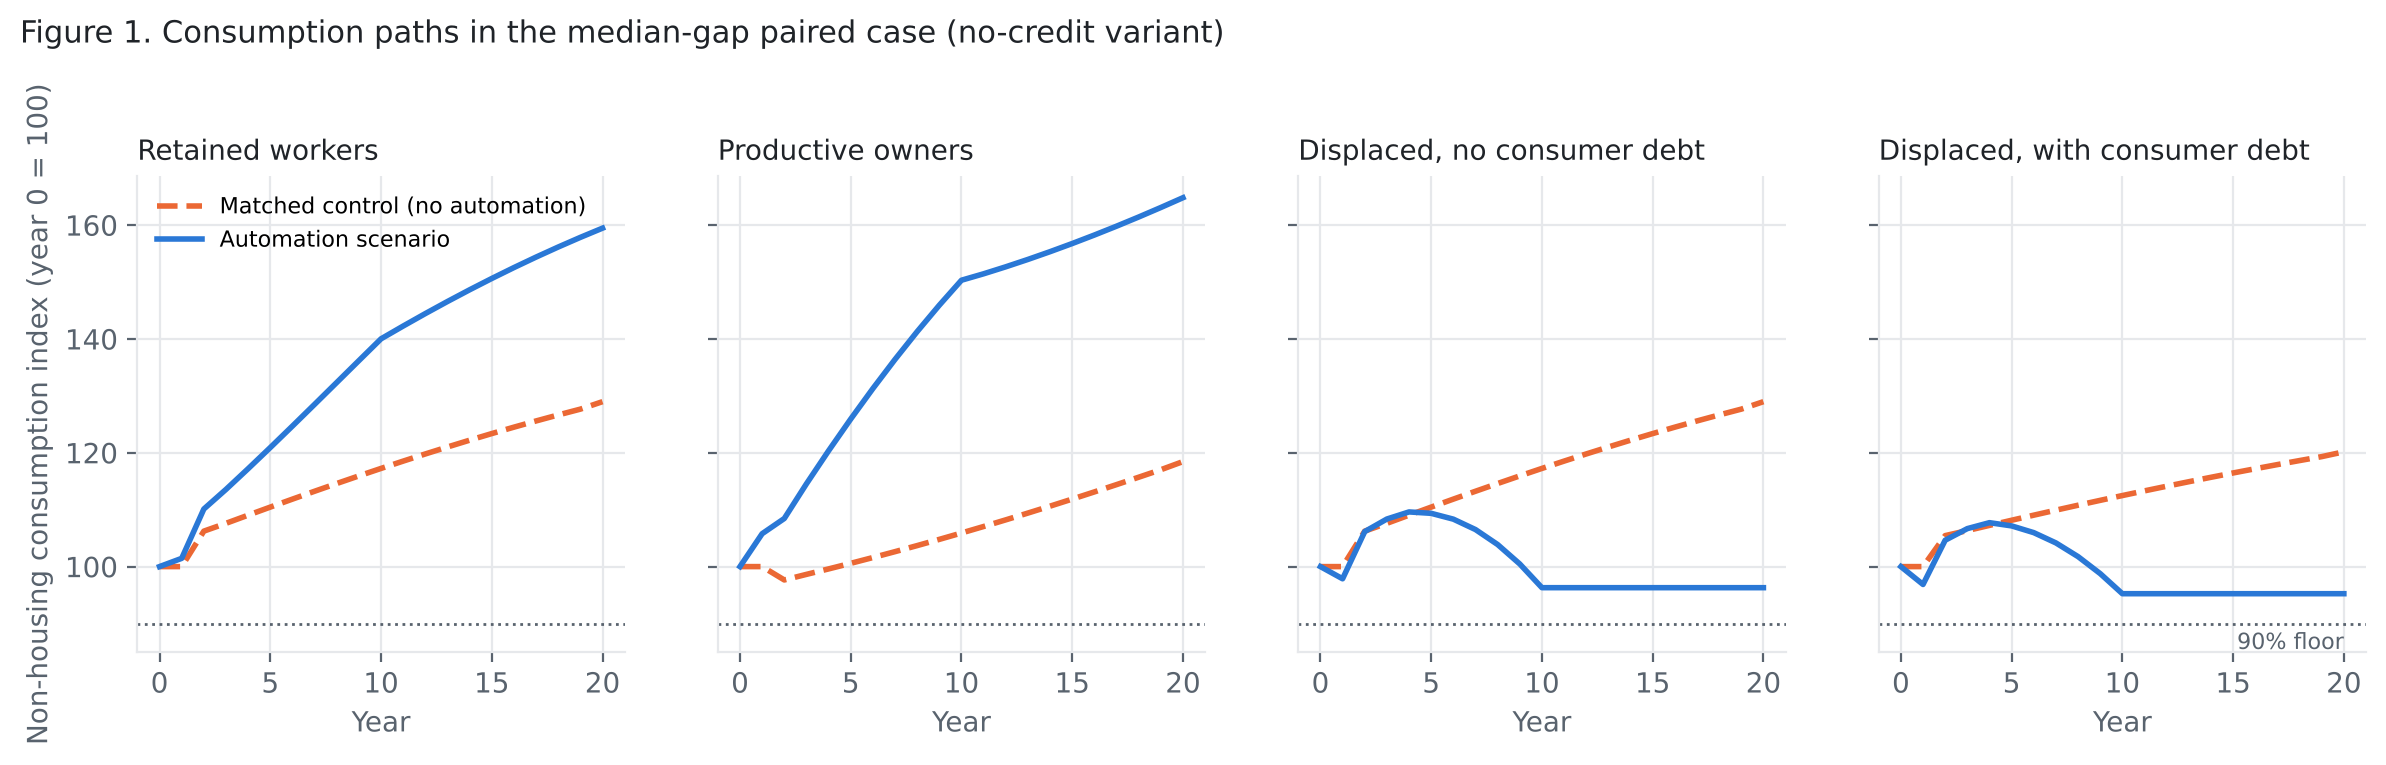
Among completed paths, displaced workers kept 90% of their consumption in only 75. How much of profits can be taxed matters more than the pass-through to prices.
To the results chapter ←Thesis in progress · Draft, November 2026
If a large share of workers lose their jobs, will lower prices and tax-funded benefits preserve their purchasing power? And under what conditions?
An uncalibrated accounting model and a descriptive empirical test. These are conditions and mechanisms, not a forecast.
75 / 202
Among completed paths, displaced workers kept 90% of their consumption in only 75. How much of profits can be taxed matters more than the pass-through to prices.
To the results chapter ←42 / 42
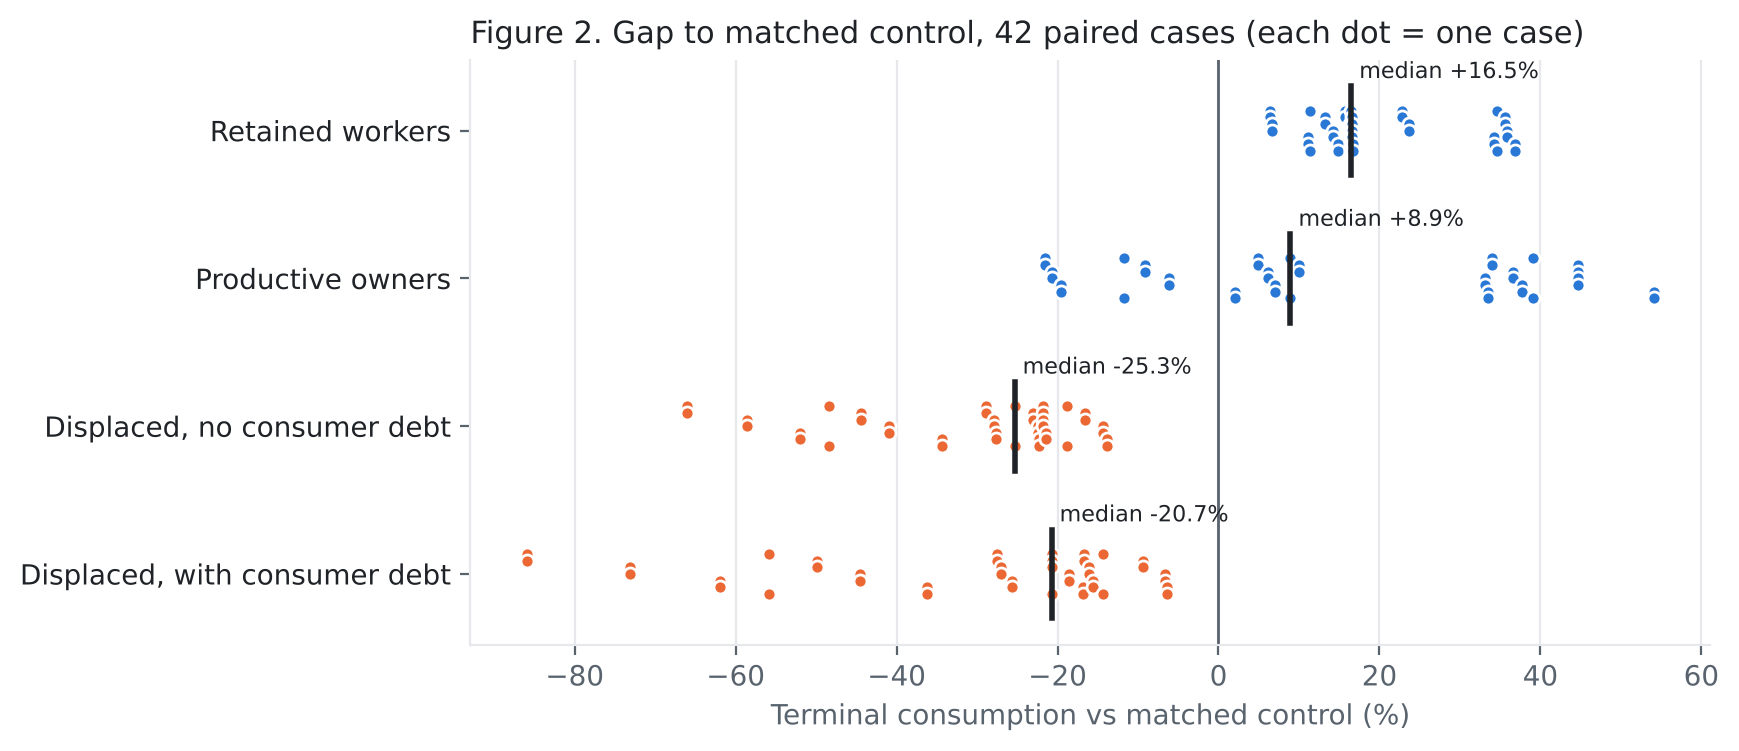
In all the adjusted comparisons, displaced workers ended up below the economy without automation. A benefit as a share of output narrows the gap only when there is budget room.
To the results chapter ←2 / 18
Nominal rent and mortgage payments do not fall with prices. Indexing the benefit to housing helps, but at peak unemployment the budget runs out.
To the full paper ←There is still no significant evidence of harm to employment in AI-exposed occupations.
Europe · 13 countries, 848 observations
β = −0.55, p = 0.32
A negative, non-significant relationship between AI adoption and employment in exposed occupations, stable across 54 tests.
Israel · Labour Force Survey 2017–2024
16% → 27%
Share of professionals among the unemployed. The over-representation of clerical workers did not grow after 2023.
The simulators let you change the pass-through rate to prices, the tax and capital ownership, and see what happens to each household group.
חיפוש בין שלבי המחקר, המודלים והמתודולוגיות. כל תוצאה מקשרת למיקום המקורי שלה ולמקורות הנלווים.
לא נמצאו מחקרים מתאימים. נסו מונח אחר או הסירו את הסינון.
Historical Bank of Israel anchor: at least 500 ₪ unpaid for more than 30 days in the first mortgage year. Not a 90-day default rate, foreclosure probability or loss rate.
Historical anchors load when this section is displayed.
| Profile at mortgage origination | Event in the first year | Rate applied to the selected number of loans | Difference versus no complementary loan, percentage points | Rate ratio |
|---|
September 2017–March 2019 cohorts per source footnote 5. The chart caption gives a different broader period; ambiguity is documented. Not a 2025 or automation forecast. No source sample size, confidence interval or causal debt effect.
The early-arrears anchor is not injected as foreclosure or loss into step 78 balances. Local tools can estimate default incidence from complete cohorts and LGD from actual recovery flows when suitable data become available.
Data, calibration method and missing inputs · Source record · Data requirements for PD and LGD
Partial matching of a reference loan to December 2025 Bank of Israel LTV, PTI and track-specific interest rates. A synthetic profile, not calibration of household distributions, default probability or loss given default.
Data anchors load when this section is displayed.
PTI is fitted only to reference income 48 using an approximate annual annuity. Not an average Israel household or predictive validation. Term and rent remain assumptions. Rate shocks do not alter fixed contractual rates.
| Group | Real consumption | Consumption difference versus the old profile | Consumption difference versus no automation transition | Real wealth | Nominal mortgage balance | Asset realization |
|---|
Normalized per-person units, not ₪. Profiles start with different assets and debt; differences from the old profile are not causal effects. 20% unemployment and default rules remain experimental assumptions.
Calibration, assumptions and remaining gaps · Source registry · Simulation results
Step 77: persistent nonpayment can trigger foreclosure, debt write-offs and lender losses. The home transfers to the lender; the borrower becomes a renter next year. Research assumptions, not legal procedures or forecasts.
Model data load when this section is displayed.
Consumption and wealth: real per-person units within each cohort. Debts: nominal per person. Cumulative loss and foreclosure costs: aggregate nominal amounts. Not borrower counts or default probabilities; residual claims remain at face value.
| Group | Nonhousing consumption | Consumption difference versus no automation transition | Total wealth | Wealth difference versus no write-offs | Consumer debt | Mortgage | Rent arrears | Residual debt after foreclosure | Housing status at year-end |
|---|
At foreclosure the home transfers to the lender; rent starts next year. Immediate write-off loss differs from terminal wealth differences. Home prices are exogenous; there are no separate banks or new credit creation.
Default mechanism, balance sheets and limitations · Scenario data
The step 77 default mechanism compares face-value claims with write-offs and foreclosures.
Step 76: housing payments reach landlords and lenders, changing consumption, saving and investment. Capital feedback can also change output and employment. Home prices are exogenous; scenarios are not calibrated.
The model loads when you open this section.
Consumption, income and wealth: normalized real units. Cash and debt: nominal units. Consumption starts at 100 separately by housing alternative. Capital owners are landlords/lenders, without separate banks; arrears claims remain at face value.
| Group | Nonhousing consumption | Consumption index | Real consumption difference versus no automation | Income after housing transfers | Cash | Share of productive capital | Mortgage balance | Rent arrears | Interest capitalized in the year | Wealth including housing |
|---|
Housing alternatives have different initial endowments. Ownership-versus-rent comparison is not causal. Interest and principal are separate; home revaluation is not income. Housing is not added again to productive-sector output.
Model, balance-sheet identities and limitations · Simulation data
The integrated step 76 model includes housing and saving flows. This earlier tool is retained for historical comparison only.
Step 75 stress test: identical income under different housing tenures. Assumption-dependent, not a forecast. Partial analysis: housing payments do not change source-model saving, output or benefits.
Housing data load when this section is displayed.
Income and residual income after housing: normalized real units. Housing payments, principal and arrears: nominal units. Each alternative starts at index 100, but ownership alternatives have different initial wealth.
| Group | Real income | Housing payment | Real income after housing | Residual-income index | Real difference versus no automation | Mortgage principal | Interest arrears | Real housing equity | Payment shortfall relative to income |
|---|
Household groups can save, trade shares and repay loan principal. Choose consumption and asset-price rules, then compare income, consumption and wealth. Unemployment benefits use the remaining funding; asset sales, company financing and liquid balances are recorded explicitly.
Consumption indices use each cohort's initial consumption. Broad ownership changes initial capital allocation; it is not a free transfer during the transition.
| Group | Real consumption per person | Consumption index | Real income per person | Income index | Liquid balance | Share of productive capital | Personal debt balance | Real wealth | Wealth change from baseline | Wealth difference versus control, year 20 | Shortfall from desired consumption |
|---|
Saving, asset prices and investment are assumptions. Investment absorbs residual output but does not feed back into productivity or employment in this version. No household optimization, estimated returns, credit losses or decile forecast. Infeasible financing/capital paths stop.
Assumptions, identities and sensitivity test · All 16 experiments and control-path summaries
Four fixed cohorts share output and government budgets. Displaced cohorts initially work, then gradually lose jobs; capital owners also remain employed. Compare two initial ownership distributions and two benefit-funding rules.
| Group | Population weight | Employment within the group | Share of productive capital | Real income after obligations | Purchasing power relative to the baseline | Baseline real wealth | Current real wealth | Wealth change | New unpaid interest |
|---|
Wealth is an accounting valuation: constant real productive-capital value, loans at face value without credit losses, and capital owners financing government. No voluntary saving, investment, housing market or individual employment probabilities. No actual top-decile identification.
Assumptions, accounting identities and conclusions · All cohort paths
Coupled wages, prices, profits, taxes and benefits. Compare debt-funded protection with residual-budget benefits. Normalized initial output 100 and labor force 1 under stylized full employment, not Israel/global data. Benefits target model unemployed, not everyone.
| Year | Unemployment % | Real output | Prices | Profits | Cash taxes | Required benefit per person | Benefit paid per person | Purchasing power % | Net debt/output % |
|---|
Productivity, tax rates and collectability are scenario assumptions. No empirical calibration, investment response, demand-price equilibrium or population-wide welfare estimate. Personal debt is a fixed nominal payment, not a simulated stock. Other government spending stays real; existing taxes are not all reused for benefits.
Formulas, assumptions and limitations · Full results and grid of 270 assumption combinations
Adjust assumptions to inspect output, prices, real benefits and debt burdens. This is a normalized illustration, not a calibrated Israel or global estimate.
Illustration: A₀=K=N=P₀=1, α=0.35, profits Π=αY; real benefit τΠ/P; debt burden D/P; other households' real capital income (1−s)(1−τ)Π/P, where s is concentrated owners' capital share. Indices use u=0. Not empirical profit, tax or welfare estimates.
Save scenarios in this browser, compare results, export research data and prepare AI methodological-review prompts. Saving is local to this device; providers are not called automatically.
| Scenario | Unemployment | Output | Prices | Real benefit | Real debt | Action |
|---|
Compare outcomes with unemployment 5 percentage points above or below the selected rate, holding other assumptions fixed.
| Unemployment rate | Output | Prices (100=baseline) | Real benefit | Real debt |
|---|
Prepare an AI-review prompt with equations, assumptions and the active scenario, asking about causal identification, units, calibration and falsification. An AI response is not scientific proof.
Compare a household before and after automation. Set labor income, benefits, capital income, taxes, debt service and price changes. Monthly ₪ amounts are illustrative only.
Prices before = 100; after = 100 × (1 + price change/100). Purchasing power = (wages + benefit + capital income − taxes − debt service)/relative prices. Break-even benefits ignore fiscal constraints, behavior and basket changes. Debt is a monthly nominal payment, not principal. Not a forecast, policy recommendation or empirical estimate.
Annual macro-fiscal model for financing universal or unemployment benefits. Illustrative amounts are in billion ₪, except headcounts and monthly benefits. Value added attributed to automation may form a separate tax base without double taxation.
Corporate tax = taxable profit × effective rate; capital income tax = separate base × rate; automation levy = additional nonoverlapping base × rate. Cost = eligible people × benefit × 12. Primary deficit includes lost labor taxes and administration. Debt change includes program deficit and existing-debt interest, assuming the rest of the pre-interest budget balances. No causal forecast or behavioral model of capital flight, base erosion, investment or avoidance.
Fund benefits through taxes on corporate profits, capital income and automation. Adjust labor replacement, tax bases and their responses, benefits, debt and interest rates. Amounts are in billion ₪ unless otherwise stated.
| Year | Unemployment % | Corporate tax | Capital income tax | Automation tax | Benefit cost | Primary fiscal balance | Debt/output % |
|---|
Tax-base sensitivity uses reference rates of 25% corporate, 20% capital and 10% automation. Lost labor taxes = 10 billion ₪ × unemployment; administration = 4 billion ₪ yearly. See DYNAMIC_FISCAL_V28.md.
Transparent search for corporate, capital and automation tax rates meeting a terminal debt/output target. Uses assumptions entered in the dynamic model above (version 28).
A terminal target does not guarantee annual compliance. The model omits endogenous productivity, capital migration, international competition and government spending outside the program. Run further sensitivity scenarios for comparison.
Stress-test the dynamic model's tax mix under six scenarios: baseline, weak growth, capital outflow, profit erosion, unemployment surge and a combined shock.
| Scenario | Terminal debt/output | Maximum debt/output | Unemployment at the end of the period | Target met at the end of the period | Target met in every year |
|---|
To stress-test the version 29 tax mix, enter its three selected tax rates in model 28, then run the stress tests.
Find a corporate, capital and automation tax mix meeting the debt/output target In all selected stress scenarios. Uses the assumptions defined in the dynamic model above.
Scenarios to test:
| Scenario | Terminal debt/output | Maximum debt/output | Target achieved |
|---|
Calculation runs in this browser without external API calls. Tax-base responses, shock probabilities and endogenous behavior are not empirically calibrated.
The repository contains an OECD panel of 38 countries and 943 observations, 2000–2024, Israel data and analyses through step 61. No new retrieval was performed now.
Research paused at step 62. Simulators depend on assumptions. Research results are descriptive, not causal estimates or approved benefit-funding calibration.
OECD panel — CSV · Sources and coverage · Israel panel — CSV
Panel 54 results · Results with macro controls 58 · Lagged-tax checks 59 · Event screening 61
Numbered sections document earlier versions and their limitations at creation. Current status refers to existing files; causal calibration is not approved even for the latest panel.
Server experiments require Analyst or Admin sign-in and retain model version. AI reviews require server API keys and may incur charges. The engine does not calibrate parameters to observed data.
| Number | Name | Version | Date |
|---|
Before empirical estimation, define the source, period, units and identification strategy. Do not label a theoretical model as calibrated.
Import World Bank API unemployment, inflation, output growth and labor productivity (real output per worker) for five countries, 2010–2024. Fetch on demand; no sample data presented as observations.
Productivity growth is annual change in real output per worker (World Bank SL.GDP.PCAP.EM.KD). No first-year growth observation. Without a verified automation series, these data cannot directly calibrate the thesis. Analyst access and external API availability are required.
Merge documented automation CSV with World Bank data by country and year. No automatic IFR/OECD fetches and no illustrative records presented as observations.
Base CSV file: country,year,unemployment,inflation,productivity (can be exported above). Automation CSV file: country,year,automation. ISO3 country codes and an automation index normalized to 0–100 are required. Normalize and document before importing.
Browser-only merge. Unmatched rows are not filled artificially; exports include complete matches only. Exporting establishes neither causality nor redistribution rights for restricted data.
Upload country-year CSV. Estimate descriptive inflation regressions or country/year fixed-effects panels using automation, unemployment and productivity growth. Preliminary association testing, not a causal estimate or structural thesis calibration.
Required headers: country,year,unemployment,automation,productivity,inflation. Percentages use percentage points; automation index 0–100. Require 15–1000 observations without duplicate country-years. Check definitions, units, licenses and sources before uploading.
Server saving requires Analyst or Admin sign-in. Results are not verified against OECD or World Bank; data are not automatically fetched here.
Every step of building the model and tests: what was tested, what came out and the limits. For the full picture, start at the thesis page. Steps not listed here are documented in the notes in Appendix A.
At Israeli values (23%, about 3.9% of output) the tax take is below the grid's lowest corner. Paths complete only when productivity doubles (44 of 144); in all others the government cannot finance its existing commitments in cash.
Tenure mix, rent burden and mortgage burden from Israeli data. For the average household the preservation rate at full pass-through stays at 26.4%, as in the uncalibrated grid. For the bottom decile it falls to 15.3%, and indexing the benefit to housing costs raises it to 34.0%. Even when rent falls with prices, the renter penalty shrinks but does not disappear. When rent rises with benefits, it worsens.
The over-representation of clerical workers in unemployment did not grow after generative AI tools (relative risk 1.34). The share of professionals among the unemployed rose to 27% in 2024.
Displaced workers reached the control path in 18 of 42 comparisons, only when the budget had slack. At peak unemployment the budget ran out in all 42.
Clerical workers, the most exposed group, were over-represented in unemployment even before generative AI tools (relative risk 1.35 and later 1.60).
It corrects the harm to renters when there is budget slack (64 of 64), but renters under full pass-through remain at 2 of 18.
A mapping of the indicators available for Israel and what is missing for a test by occupation.
Nominal housing payments versus a goods-indexed benefit, and a tax base that shrinks with prices.
Sensitivity to the 90% threshold and the size of the gap from the control across the 42 cases.
The sign is negative in all 54 tests, and none is significant at 5%.
נבנתה תשתית לאיסוף ואימות סדרות תוצר, תעסוקה, תוצר לעובד ומדד מחירים מתוך World Bank WDI, עבור ישראל וארבע מדינות השוואה בשנים 2015–2024.
תוצאות משיכה מאומתות: 20 מתוך 20 סדרות נמשכו בהצלחה, עם 200 תצפיות לשנים 2015–2024 וללא שגיאות משיכה מדווחות. נתוני שכר עדיין חסרים. תוצר לעובד אינו אומדן להשפעת אוטומציה, ויחס תעסוקה לאוכלוסייה אינו שיעור אבטלה.
לא עודכנו פרמטרים מבניים במודל; נתוני המקור כפופים לעדכונים ולבדיקות השוואתיות נוספות.
נבדקות תשע תצפיות מדווחות ומעוגלות של הכנסות ממס חברות ביחס לתוצר בישראל, ממספר מהדורות OECD. הנתונים אינם רציפים ואינם מזהים שיעור מס אפקטיבי או השפעה סיבתית של אוטומציה.
תוצאות בדיקה מאומתות: ממוצע מס חברות ביחס לתוצר במדגם: 3.23%; חציון: 3.20%; טווח: 2.60%–4.30%; טווח ממוצעים בהשמטת תצפית אחת: 3.10%–3.31%. אלה מדדים תיאוריים מתשע תצפיות מעוגלות, לא שיעור מס אפקטיבי ולא כיול מבני.
לא עודכנו פרמטרים במודל. חסרים נתונים רציפים ומאומתים ושיטת זיהוי לפני כיול אמפירי.
הניסוי משווה ארבע שיטות לתמחור מניות, שלוש תוכניות השקעה, ארבע גמישויות הון, שלוש רצפות צריכה וחמישה שיעורי שימור רווחים — 720 מסלולים, ללא כיול אמפירי.
תוצאות מאומתות: מתוך 144 מסלולים לכל שיעור שימור, הושלמו 132 ללא שימור, 120 בכל אחת מחלופות 25%, 50% ו־75%, ו־90 בשימור מלא. מספר ההצלחות המחקריות היה 132, 93, 69, 48 ו־18 בהתאמה.
בשיטת תמחור לפי מכפיל דיבידנדים, שימור מלא הביא למחיר מניה מחושב של אפס ול־36 עצירות. זהו מאפיין של כלל התמחור במודל, לא הוכחה לחדלות פירעון. הניסוי אינו מכויל ואינו מזהה סיבתיות.
המחקר משווה 1,296 זוגות תרחישים תואמים בארבע חלופות שימור רווחים, תוך שימוש רק בשנים שבהן שתי החלופות השלימו את הפעולות החשבונאיות. פירוק השינוי ביתרת המזומנים: יתרת פתיחה, רווחים נשמרים, גיוס הון נטו והוצאות השקעה.
ממצאים מאומתים: בכל חלופת שימור רווחים, 27 תרחישים עברו מהשלמה לכשל ולא נצפה מעבר הפוך. ב־27 המסלולים הללו, ממוצע הירידה ביתרת המזומנים בשנת הפעילות המשותפת האחרונה הוא 15.30, 14.21, 22.00 ו־21.11 יחידות מודל עבור שימור 25%, 50%, 75% ו־100% בהתאמה. תוספת הרווחים הנשמרים לא קיזזה את גידול ההשקעות ואת השינוי ביתרת הפתיחה ובגיוס ההון.
זהו פירוק חשבונאי מותנה במסלולים, לא זיהוי סיבתי או תחזית מכוילת. פירוט מלא בדוח.
הניסוי משווה כל אחת מארבע חלופות שימור הרווחים מול תרחיש 0% בעל אותם פרמטרים. רק כישלונות שהתרחשו באותה שנה ניתנים להשוואת תזרימי שנת הכשל; יתר המקרים מדווחים בנפרד.
מטרת המחקר: לפרק את השינוי ביתרת המזומנים לרווחים נשמרים, גיוס הון ממשקי בית והשקעה, בלי לבלבל בין זהות חשבונאית להוכחה סיבתית. הניסוי אינו מכויל אמפירית.
תוצאות הניסוי: בכל אחת מחלופות שימור הרווחים, 27 תרחישים שהושלמו ללא שימור נכשלו עם שימור; לא נמצא מעבר מכישלון להצלחה. מספר ההצלחות שאבדו לפי תנאי המחקר: 57 בשימור 25%, 96 בשימור 50%, 156 בשימור 75% ו־213 בשימור 100%.
לא נמצאו זוגות כושלים שנעצרו באותה שנה, ולכן לא חושבה השוואת תזרים לשנת הכשל. אין לפרש את תוצאת האפס כהיעדר השפעה. הניסוי אינו מכויל אמפירית.
נרשמו התזרימים המתוכננים שנדחו בכל 243 העצירות, כולל יתרת פתיחה, רווחים שנשמרו, גיוס מניות נטו והשקעות. הסכומים להלן הם סכומי פערי מזומנים בתרחישים שנכשלו, ביחידות המודל — לא הפסדים שהתממשו.
| שימור רווחים | מסלולים שנכשלו | סכום פערי מזומנים |
|---|---|---|
| 0% | 27 | 302.97 |
| 25% | 54 | 220.20 |
| 50% | 54 | 349.23 |
| 75% | 54 | 768.84 |
| 100% | 54 | 606.70 |
קבוצות המסלולים שנכשלו שונות בין החלופות, ולכן אין להסיק מסכומים אלה ששיעור שימור מסוים עדיף. נדרשת השוואה של תרחישים תואמים.
נבדקו 1,620 מסלולי תרחישים. כל 243 העצירות שנבדקו הופעלו בשל יתרת מזומנים שלילית בחברות, ללא כשל מקביל במגבלות ההון הריאלי או פדיון המניות. שיעור השימור 0% הניב 27 עצירות, וכל אחת מחלופות 25%–100% הניבה 54.
הזיהוי הוא של תנאי העצירה הישיר במודל; הוא אינו מוכיח מה גרם לשינוי בתזרים. תרחישים אינם תצפיות אמפיריות או הסתברויות.
ניסוי תרחישים תיאורטי שאינו מכויל לנתוני אמת. נבחנו 1,620 מסלולים, 324 לכל שיעור שימור רווחים. התוצאות אינן הסתברויות ואינן תחזית.
| רווחים נשמרים | הושלמו | עמדו בתנאים | נכשלו |
|---|---|---|---|
| 0% | 297 | 267 | 27 |
| 25% | 270 | 210 | 54 |
| 50% | 270 | 171 | 54 |
| 75% | 270 | 111 | 54 |
| 100% | 270 | 54 | 54 |
ממצא: במודל הנוכחי שימור רווחים לבדו לא פתר את מגבלת המימון, והפחית את מספר המסלולים שעמדו ברצפת הצריכה ובתנאי המימון. מנגנון הכשל המשולב עדיין דורש פירוק נוסף (שלב 125).
פרוטוקול, ממצאים ומגבלות — V124 · הרצת הניסוי ונתוני התוצאות (GitHub)
הגבלת ההשקעה היצרנית לסחורות הזמינות מאפשרת ל־13 מסלולים נוספים להשלים את התקופה: 297 מתוך 324. עשרה מהם עומדים גם בדרישות ההעברות ורצפת הצריכה; מספר ההצלחות המותנות עולה ל־267. 27 כשלי המימון בחברות נשארים, גם בביקורת ללא תוספת צריכה.
המחיר הוא פחות הון יצרני: 1.15–24.09 יחידות ריאליות ביחס לתוכנית השקעה על אותו מסלול תפוקה. בכל המקרים שבהם הכלל פעיל, התפוקה אינה מגיבה להון לפי הנחת התרחיש; לכן אין כאן הוכחה להיעדר מחיר עתידי בהכנסה. הביקורת המקורית נעצרת לפני הקיצוץ הראשון, ואין השוואת הכנסה תקפה לשנת הסיום.
המלאי נכלל בצורכי המימון; לא נוסף כסף או אשראי. תוצאות מודל מותנות, ללא כיול אמפירי.
שלב 122 · מה עצר את המסלולים?
שוחזרו חשבונות שנת הכשל בכל 40 המסלולים שנעצרו. ב־13 מקרים יעד ההשקעה והצריכה דורשים יותר סחורות מהייצור והמלאי, אף שלחברות נותר מזומן חיובי.
ב־27 מקרי המזומן אין מס או תוספת צריכה בפועל, והביקורת נכשלת באותו אופן. ההשקעה דורשת כ־25.89 יחידות לעומת מזומן וגיוס הון של כ־14.67 — פער מימון של כ־11.22.
זהו אבחון חשבונאי, ללא שינוי מסלולים או הזרמת מימון. הפערים תלויים בכללי המודל ואינם מוכיחים מגבלת ייצור או אשראי בעולם האמיתי. 27 תוויות המקרים משחזרות כאן אותו מסלול ביקורת, ולא ראיות עצמאיות נגד העברות.
חשבונות הכשל, ההשוואה לביקורת והמגבלות · כל 40 האבחונים והחשבונות התואמים
שלב 121 · רגישות להון ולכלל ההשקעה
נבדקו 324 מסלולים בארבע רגישויות תוצר להון ובשלושה כללי השקעה. 257 עברו את הבדיקות המלאות: ב־149 שולמה תוספת, וב־108 לא נדרשה תוספת. 27 הושלמו עם צורך לא ממומן ו־40 נעצרו.
13 מסלולים דרשו מלאי שלילי ו־27 נעצרו במגבלת מזומן של החברות. בבדיקת הרגישות הגבוהה וכלל השארית גם הביקורת נכשלת, ולכן התוצאות אינן מסווגות כהשוואה מוצלחת.
בחלופות ההשקעה המתוכננת, הפער בין השקעה כוללת להשקעה בהון יצרני נרשם במלאי. זהויות המזומן והמשאבים נבדקות בנפרד. זו בדיקת הנחות שנתית ללא כיול אמפירי, לא הסתברויות להצלחה או לכשל בעולם האמיתי.
כללי ההשקעה, טבלת הרגישות וכשלי המסלול · כל הביקורות, המסלולים והמלאים
שלב 120 · תוספת לפי הפער בפועל
נבדקו 54 זוגות מסלולים שנתיים. 45 מסלולים עם הכלל המותאם עברו את בדיקות המימון והצריכה, לעומת 18 עם לוח קבוע. במצב המשוב ההוני הביקורת כבר עומדת בספים, והכלל החדש משחזר אותה ללא מס או מענק נוסף.
בכל שנה מחושבת הבקשה הקטנה שמכסה גם את פער ההכנסה לצריכה וגם את מגבלת המשאבים. התשלום בפועל מוגבל למס שנגבה מדיבידנדים ולמזומן המשלם.
זהו מענק שנתי מוגבל מימון, לא הבטחה לקצבה: צורך שלא מומן נשמר בתוצאות ואינו הופך לחוב תשלום עתידי. ההשוואה ללוח הקבוע כוללת גם הבדל זה. אין כאן אימות תזמון חודשי או כיול אמפירי.
כלל הבקשה, תוצאות והבדלי ההתחייבות · כל הזוגות, המימון והצורך שלא נסגר
שלב 119 · חיבור שנתי לחברות ולהון
נבדקו 54 מסלולים שנתיים עם מס, תוספות צריכה והחלטות השקעה מחושבות מחדש. כולם הושלמו; 18 עברו את בדיקות הגבייה, התשלום והצריכה. בביקורת עם המשוב ההוני הספים כבר מתקיימים, ולכן אין לייחס לתוספות את עצם שימורם.
בדוגמה של סף 90%, תקרה של 10% ותגובה למס של 0.5, ההון בסוף התקופה נמוך בכ־3.17% והדיבידנדים בכ־1.47% לעומת ביקורת תואמת. שינוי הנחת התגובה יכול להפוך את כיוון התוצאה.
זהו חיבור שנתי: אין בו אימות תזמון חודשי. ההשקעה נקבעת כשארית התוצר, רגישות ההון היא הנחת מודל, ואין כיול אמפירי או שיווי משקל מלא.
הצעד הבא: לגזור תוספת מהפער שנוצר בפועל בכל מצב שנתי, במקום לכפות לוח תשלומים קבוע גם כאשר אינו נחוץ לסף.
מנגנון המשוב, ההשוואות והמגבלות · כל המסלולים והביקורות השנתיות
שלב 118 · מימון מהכנסה שוטפת
נבדקו 324 מקרים בשלושה בסיסי הכנסה וארבע תקרות גבייה. 111 עמדו בבדיקות הגבייה, התשלום והצריכה; 213 נכשלו. ללא הפחתת הכנסה, תקרה של 5% אינה מספיקה ואילו 10% מספיקה למקרים שנבדקו.
כל בסיסי הגבייה מוציאים תקבולי קרן ויתרות מזומן. אלו תקרות ניסוי על תקבולים שוטפים, לא שיעורי מס מומלצים או בסיסי מס משפטיים. המימון נבדק לתוספת בלבד, ללא משוב מקרו.
כ־81% מההכנסה השוטפת המצטברת של בעלי ההון בתרחיש המקורי הם דיבידנדים. הצעד הבא הוא לבדוק כיצד המס וההעברות משפיעים על השקעה, מזומן החברות ודיבידנדים עתידיים.
שלב 117 · מבחן לחץ למימון התוספת
נבדקו 1,404 מקרי לחץ ו־156 ביקורות תואמות. 1,008 מקרים עמדו בגבייה בזמן, בתשלום התוספות ובספי הצריכה החודשיים והשנתיים; 396 נכשלו ונשארו בתוצאות.
בסף 90%, נקודת ההכנסה הנמוכה ביותר שעברה ברשת היא 4.5% מרכיב ההכנסה שהופחת; 4% נכשלו. בספים 95% ו־100%, נקודות המעבר שנבדקו הן 5.5% ו־6.5%.
אלו נקודות בדיקה במודל, לא אומדן לעמידות כלכלה במציאות. ריבית פרטית ופדיון אג״ח לא הופחתו, הכנסות המקבלים נשארו קבועות, ואין משוב תוצר. רצפות הצריכה וסכומי התוספת נשארו ללא שינוי לאורך מבחן הלחץ.
הצעד הבא: להפריד הכנסה שוטפת של משלם המס מתקבולי קרן ולבדוק מס המוגבל לבסיס הכנסה מוגדר.
שלב 116 · מס והעברה במזומן בפועל
נבדקו 27 מקרים: שלושה ספי צריכה, שלוש הנחות לתגובת בעלי ההון למס ושלושה מועדי גבייה. בתשעת מקרי הגבייה החודשית התוספות שולמו בזמן ושתי קבוצות מאבדי העבודה עמדו בספי הצריכה השנתיים והחודשיים.
ב־18 מקרי הגבייה הרבעונית או בדצמבר הסף השנתי התקיים, אך היו פיגורי העברה וחודשים מתחת לסף החודשי. הקופה מתחילה ללא מזומן ואינה מקבלת אשראי או השלמה חיצונית.
בסף 90% ובהנחת תגובה של 0.5, צריכת בעלי ההון המצטברת ירדה בכ־1.97% לעומת הביקורת. המימון מאומת לתוספת בלבד: ההכנסות, המחירים ותוכניות ההשקעה הבסיסיות עדיין קבועים, ואין כיול אמפירי או אימות תקציב ממשלתי מלא.
כללי הגבייה, תזמון, עלות ומגבלות · כל 27 המקרים וחשבונות התוספת
שלב 115 · כמה משאבים חסרים?
לספים של 90%, 95% ו־100% מצריכת שנת הביקורת הראשונה, תוספת ההכנסה הנומינלית המחושבת מגיעה בשיא לכ־2.21%, 2.55% ו־2.90% מתוצר המודל. שלושת השיאים בשנה 10.
זהו חישוב צורך סטטי לפי כלל ההוצאה הקיים של 90% מההכנסה. אין עדיין העברה נוספת בסימולציה או מקור מימון מאומת. שנת הביקורת הראשונה אינה נקודת ייחוס מלפני האוטומציה.
החישוב מפריד בין ערך הצריכה החסרה לבין ההכנסה הדרושה כדי לממנה לפי כלל המודל. הצעד הבא הוא ניסוי חודשי עם משלם מס מפורש, העברה ממוקדת ובדיקת הרצפה לאחר תגובת משקי הבית.
שלב 114 · פירוק הירידה בצריכה
בנקודת השפל, בשנה 10, הצריכה הריאלית היא 64.12% ו־50.67% משנת הביקורת הראשונה בשתי קבוצות מאבדי העבודה. העברות, דיבידנדים וירידת מחירים מקזזים חלק מאובדן השכר, אך אינם משלימים אותו.
בביקורת אין מחסור מזומן לצריכה המתוכננת בשתי הקבוצות. הצריכה יורדת לפי כלל ההוצאה מתוך ההכנסה. זהו פירוק חשבונאי מדויק של התרחיש, ללא הסקה סיבתית או כיול אמפירי.
שירות הקרן נרשם כהעברת נכס ואינו מופחת שוב מההכנסה. השינוי בתחזוקה הנומינלית הוא אפס; השפעת המחירים על הנטל הריאלי נשמרת בפירוק.
הצעד הבא: לחשב את הפער מסף צריכה מוצהר ואת המשאבים הדרושים, לפני בחינת העברה נוספת עם מימון מפורש.
הפירוק, טבלת התרומות והמגבלות · רכיבים שנתיים וזהויות חשבונאיות
שלב 113 · גבולות שימור כוח הקנייה
נבדקו 126 מקרי מיסוי ו־42 ביקורות תואמות, ב־21 ערכי תגובה מוצהרים למס. 15 מקרים נכשלו בלוח הגבייה הנדרש ונשארו גלויים בנפרד.
גם בביקורת, הצריכה השנתית המינימלית של קבוצות מאבדי העבודה מגיעה ל־64.12% ול־50.67% מצריכת שנת הביקורת הראשונה. אף מקרה שנבדק אינו שומר בכל שנה על 90% מהעוגן הזה בשתי הקבוצות. שנת הביקורת הראשונה אינה נקודת ייחוס מלפני האוטומציה.
בגבייה רבעונית ובמיסוי קבוצות מאבדי העבודה, סף 99% מהביקורת מתקיים במצטבר עד תגובה של 0.25, אך בכל שנה רק עד 0.10, מבין נקודות הרשת שנבדקו. אלו תוצאות מותנות במודל, ללא כיול אמפירי או משוב מקרו מלא.
הצעד הבא: לפרק את הירידה בביקורת להכנסה והעברות, מחירים, שירות חוב והוצאות תחזוקה.
שלב 112 · בדיקת התאמה למודל
אומתו יחידות האומדן, אופק הזמן ואי־הוודאות. מדד הרכב אינו מדידה ישירה של כלל הצריכה, ולכן לא שונו פרמטרים או טווחי הרגישות.
הצעד הבא: לחשב גבולות מותנים לשימור כוח הקנייה של מאבדי העבודה תחת הנחות תגובה שונות למס, ולסמן בנפרד כשלי מימון ופגיעה בצריכה.
שלב 111 · ראיות אמפיריות לתגובת צריכה למס
נבדקו ארבעה מקורות ראשוניים: סקרי מס שכר, עסקאות סביב תשלומי מס, ונתונים מנהליים של בעלי בתים. המדדים והאופקים שונים, ולכן לא אוחדו למקדם אחד.
שער הכיול נותר סגור: כוונת הוצאה, שיעור משיבים ומדד רכישות רכב אינם מקדם תגובה לצריכה הכוללת. כל פרמטרי המודל ותרחישי הרגישות של שלב 110 נשארו ללא שינוי.
התרומה לתזה היא הגדרה מדויקת יותר של אי־הוודאות במימון ההעברות. הצעד הבא הוא בדיקת הזיהוי, יחידות האומדן ואי־הוודאות במחקר בעלי הבתים, לפני החלטה על התאמה למודל.
נבדקו 48 מקרים בשישה פרופילים מוצהרים של תגובה למס. כלל ההכנסה הבסיסי של 90% נשמר, ולכל חלוקת מס הותאמה ביקורת עם אותן הנחות. מקדמי התגובה הם הנחות רגישות, לא אומדנים אמפיריים.
כאשר תגובת בעלי ההון למס נמוכה, מיסוי שלהם גורר ירידה מצרפית קטנה יותר. בהנחת תגובה הפוכה, סדר ההשוואה בין חלוקות המס מתהפך. בשלושה ממקרי מיסוי משקי הבית לא נתמך לוח הגבייה הממומן, והם הוצאו מההשוואה המותנית במימון מלא.
11 בדיקות חדשות עברו לצד 61 הקודמות. התוצאה אינה מזהה מדיניות מיטבית: היא מראה מדוע נדרש עוגן אמפירי לתגובות למס. המחירים, ההכנסות החיצוניות והדיבידנדים עדיין קבועים, ואין משוב מקרו מלא.
פרופילי התגובה, היפוך ההשוואה ושער הגבייה · סיכומי 48 המקרים וחותמות המקור
המס שמממן את הריבית הוקצה לארבע קבוצות משקי הבית: לבעלי ההון בלבד, לפי נפש, או לשתי הקבוצות החשופות לאובדן עבודה. הגבייה ירדה ממזומן הקבוצות עצמן, ללא השלמה ממשלם מס חיצוני. בכל שמונה החלופות שנבדקו, לרבות הביקורות, סכום הגבייה ולוח התשלומים נתמכו.
בחלופת הגבייה בדצמבר, חלוקה לפי נפש הפחיתה את הצריכה הריאלית המצטברת ב־2.84% בקבוצה ללא חוב אישי וב־3.98% בקבוצה עם חוב, לעומת ביקורת עם מימון חיצוני. הטלת מלוא המס על בעלי ההון הפחיתה את צריכתם ב־2.25%. אלה תוצאות של 20 שנות מודל, לא אומדנים אמפיריים.
11 בדיקות חדשות עברו לצד 50 הקודמות. כלל הצריכה המשותף של 90% יוצר כמעט אותה הפחתה מצרפית בכל חלוקת מס. הפער היחסי בין קבוצות החוב אינו מוכיח השפעה סיבתית של החוב. המחירים וההכנסות החיצוניות עדיין קבועים, וטרם בוצע שילוב מקרו מלא.
חלוקת המס, גבייה, צריכה וגבולות ההסקה · תוצאות הקבוצות וחותמות המקור
נבדקה כרית ממשלתית שממומנת בהלוואה ממלווה מפורש, עם ריבית חודשית וקרן שמגיעה לפירעון בסוף התקופה. מקורות המזומן ההתחלתיים של המלווה ושל משלמי המסים זהים בכל שמונה החלופות.
בגבייה רבעונית, ללא כרית נרשמו 160 חודשי פיגור. כרית בעלות אפס מנעה אותם; עם ריבית שנתית של 4% וללא מקור לעלותה נותרו 107 חודשי פיגור וקרן שלא נפרעה. כרית מעט גדולה יותר, עם תוספת מס שמממנת את הריבית, מנעה פיגורים ואפשרה פירעון מלא. הריבית היא הנחת ניסוי.
12 בדיקות חדשות עברו לצד 38 הבדיקות הקודמות. ההכנסות והמחירים עדיין קבועים: העלות לממשלה נרשמת, אך השפעת המס הנוסף על צריכת משלמיו טרם נבחנה. אין כיול אמפירי או הוכחת קיימות.
מימון הכרית, עלות המס, פירעון הקרן וגבולות התוצאה · שמונה החלופות וחותמות המקור
קופת ההעברות ששמורה מראש הוחלפה בגביית מסים מתוזמנת ובהתחשבנות על הוצאות ממשלה, ריבית, קצבאות ופירעון אג״ח. בשש חלופות תזמון שוחזרו החשבונות הממשלתיים בסופי השנים, ללא אשראי ממשלתי חדש.
בגבייה רבעונית וקצבאות חודשיות נוצרו פיגורי תשלום ב־160 מתוך 240 חודשים, אך הקבוצה שנבדקה מימנה את צריכתה המתוכננת מהמזומן שברשותה. בגבייה רק בדצמבר ובקצבאות חודשיות נרשמו 220 חודשי פיגור ו־11 חודשי מחסור לצריכה. פיגור בקצבה ומחסור לצריכה הם מדדים נפרדים.
12 בדיקות חדשות עברו. מועדי הגבייה וסדר הקדימויות הם הנחות ניסוי; ההכנסות והמחירים נשארים קבועים. אין עדיין משוב חברות, אומדן אמפירי או הוכחת קיימות של הקצבאות.
גבייה, פיגורים, התאמת התקציב ומגבלות הניסוי · תוצאות שש החלופות וחותמות המקור
מומשה התאמה חודשית לקבוצת מאבדי העבודה ללא חוב אישי, בתרחיש דירה ללא משכנתה ובמסלול ברירת המחדל. פריסה חודשית אחידה משחזרת את הצריכה, המזומן והחזקות המניות בסופי השנים. 11 בדיקות חדשות עברו לצד 15 בדיקות הרכיב החודשי.
באותו תקציב העברות שנתי, תשלום בדצמבר יוצר מחסור ביחס לצריכה המתוכננת ב־11 מתוך 240 חודשים; באותה פריסה ועם אפס מזומן התחלתי נרשמו 39 חודשים כאלה. מספר החודשים מתחת ל־90% מצריכת הייחוס הוא מדד נפרד.
זו בדיקת תזמון מותנית: ההכנסות, המחירים והצריכה הרצויה נשארים קבועים, ומימון ההעברות שמור מראש. אין עדיין התאמה חודשית לקופת הממשלה ולתזרים החברות המקוריים, כיול אמפירי או שילוב משוב מקרו.
התאמת החשבונות, התוצאות ומגבלות הניסוי · תוצאות שנתיות, חודשי מחסור וחותמות מקור
מומש רכיב חשבונאות חודשי נפרד עם העברות ממומנות, מגבלת מזומן, שירות חוב וצד נגדי לכל תשלום. 15 בדיקות אוטומטיות עברו, לרבות מעבר מדצמבר לינואר וצבירת פיגורי ריבית ללא יצירת מזומן.
בדוגמה סינתטית, העברה של 120 בינואר מאפשרת לממן צריכה בסיסית של 10 בכל חודש. אותו סכום שמתקבל רק בדצמבר מממן 10 באותה שנה, ו־110 נשארים במזומן; הצורך שלא מומן בחודשים הקודמים אינו נעלם בסיכום שנתי. זו הדגמת תזמון בלבד, ללא אומדן אמפירי.
הרכיב טרם שולב במודל המקרו. פרמטרי התגובה הם הנחות בדיקה, ומיפוי הדיור, הנכסים והמקורות עדיין פתוח.
כללי הרכיב, התוצאות ומגבלותיהן · תזרימים חודשיים וחשבונות נגדיים
הוגדר מפרט לחיבור תגובת צריכה חודשית לחשבונות השנתיים: מועדי קבלה, מגבלות מזומן, חיסכון, שירות חוב ומעבר בין שנים. ביקורת הקוד מראה שחלוקה של סכום שנתי ל־12 אינה מספיקה, ושיש למנוע ספירה כפולה של העברות שכבר נכללות בהכנסה.
מסלול הגישה הנוכחי לנתונים נסגר בעקבות תשובת ספק שדווחה לחוקר. אין נתוני משתתפים או כיול חדש. השלב הבא הוא בדיקת חשבונות חודשיים בנתונים סינתטיים, ובהמשך בחינת התאמה של מקורות ציבוריים.
מפרט המדידה, ביקורת הקוד וחלופות הנתונים · כללי החשבונאות ותנאי הבדיקה
נבדקו הגדרות האמידה במאמר המלא ובחלקי הנספח. הופרדו אומדנים אמפיריים מתוצאות המודל המבני, ונשמרו בנפרד אופק הזמן, יחידות המדידה ואי־הוודאות.
לתזה נדרש חיבור מפורש בין העברה ממומנת, תגובת צריכה ותזרים שנתי. שער הכיול נשאר סגור: לא שונו פרמטרים ולא בוצע שכפול. הצעד הבא הוא חוזה מדידה לחיבור תגובה חודשית לחשבונות המודל.
מופו חמישה מקורות ראשוניים לשלוש חוליות התזה: פריון ומחירים, רווחים וגביית מס, והעברות וצריכה. יש תמיכה בכיוונים מסוימים לצד מגבלות של שוק, מדינה, זמן ושיטת זיהוי. אף מקור לא מאשר כעת כיול מספרי חדש למודל.
גמישות מחיר ביחס לאוטומציה אינה מקדם התמסורת במודל; אומדן תוספת מס אינו שיעור הרווח שניתן לגבות; תגובה לקצבה זמנית אינה שיעור הצריכה הקבוע או הוכחה לכוח קנייה תחת אבטלה קבועה. סקירת תקציר אינה שכפול מחקר.
מפת הראיות, גבולות ההתאמה וסדר העדיפויות · רשומת המקורות ומצב שערי הכיול
באילו תנאים 20% אבטלה לצד אוטומציה יכולים לשמר צריכה של מאבדי עבודה, וכיצד חוב ובעלות על הון משנים את התוצאה? סיכום אותם 576 תרחישים בשבע חלופות מימון מוצא 202 שהושלמו בכולן, 18 שהושלמו רק בחלקן ו־356 שלא הושלמו באף חלופה.
ב־75 צירופי הנחות נשמרו לפחות 90% מצריכת ההתחלה שאינה דיור בשתי קבוצות מאבדי העבודה בכל החלופות. אבל כל 202 המקרים המשותפים אינם זקוקים לאשראי חברות: העקביות אינה אישוש עצמאי למנגנון האשראי. ב־42 זוגות ההשוואה המשותפים, צריכת מאבדי העבודה בסוף התקופה נמוכה מהביקורת.
המסקנה תיאורטית ומותנית: ירידת מחירים והעברות עשויות להספיק בחלק מההנחות, אך אינן מבטיחות שימור צריכה לכולם. מימון ציבורי, חוב ובעלות על הון חשובים. עדיין אין הוכחה אמפירית או תחזית לעשירונים.
שאלת המחקר, הממצאים, גבולות ההסקה וסדר העדיפויות · סיווג התרחישים וההשוואה בין החלופות
נוסף כלל הממיר חוב חברות למניות לאחר רצף אי־תשלום, עם דילול בעלי המניות והקצאת מניות למלווים. לאחר ההמרה אין אשראי חדש. ההסדר אינו מכניס מזומן ואינו משנה מיידית את מלאי ההון.
מתוך 576 תרחישים: 220 הושלמו ללא הסדר, 215 בהסדר לאחר שנת אי־תשלום אחת, ו־220 לאחר שנתיים או שלוש. בכלל של שנתיים נצפו 37 הסדרים, ורק 5 מהמסלולים האלה הושלמו. אין שיפור במספר ההשלמות. ההשוואה כוללת גם הפסקת אשראי ואינה מבודדת השפעה של תזמון בלבד.
שווי המניות הוא הנחה חיצונית. אפס הפסדי שיערוך למלווים ברשת שנבדקה אינו גבייה במזומן או הוכחה להעדר סיכון. אלה סימולציות ללא כיול, ולא הליך משפטי או אומדן התאוששות.
כללי ההסדר, חלוקת הזכויות והתוצאות · נתוני סיכום חלופות ההסדר
מתוך 18 המסלולים הנוספים שהושלמו עם תקרת אשראי 60, רק 2 שילמו את כל הריבית והקרן המתוכננת במזומן. ב־16 הייתה ריבית שנוספה לחוב ופחות החזר קרן מהמתוכנן; ב־5 הריבית נוספה לחוב לפחות שנתיים רצופות. 202 המסלולים המושלמים ללא הלוואה מוצגים בנפרד.
נבדקה גם חשיפת משקי הבית המלווים. שיעור גבוה של תביעות אשראי בתוך המזומן ותביעות האשראי אינו שיעור מהעושר הכולל. תרחישי תספורת הם חשיפה ברוטו בלבד, ללא הסתברות לכשל או הפסד ממומש. אין שינוי בכללי המודל או כיול אמפירי.
שירות חוב, היוון ריבית וסיכון המלווים · נתוני הסיכום והחשיפות
משקי הבית מלווים לחברות מתוך מזומן שנותר לאחר החלטות הצריכה וההשקעה; זהו כלל מכני ולא היצע אשראי אופטימלי. כל הלוואה מפחיתה מזומן אצל המלווים ומוסיפה תביעה תואמת. אין יצירת כסף חדש. נרשמים ריבית, החזר קרן, מגבלת אשראי והיוון ריבית שלא שולמה.
מתוך 576 תרחישים בכל חלופה: 202 הושלמו ללא אשראי, 212 עם תקרה של 20 ו־220 עם תקרה של 60 ביחידות מודל. רוב מגבלות המימון נשארו. ריבית מהוונת בחלק מהמסלולים, ואין עדיין טיפול בחדלות פירעון של חברות או בהפסדי המלווים. השלמת מסלול אינה הוכחה ליכולת פירעון או לשיפור ברווחה.
כללי האשראי, הזהויות, התוצאות והמגבלות · סיכום ארבע חלופות האשראי
בכל 230 העצירות של החברות ברשת המקורית, המגבלה הראשונה הייתה מזומן שלילי. לא נפרצה באותו צעד מגבלת מלאי ההון או המניות. ההשקעה וגיוס ההון היו חיוביים, אך הגיוס והמזומן הקיים לא הספיקו להשקעה שנקבעה כשארית התוצר.
בדיקת ארבעת כללי תמחור המניות הקיימים הניבה 200–211 מסלולים מושלמים מתוך 576 בכל כלל. רוב העצירות נשארו. זו מגבלה של שילוב כללי ההשקעה והמימון במודל, ולא תחזית לחדלות פירעון או הוכחה ששחיקת הון היא הסיבה. המודל המקורי לא שונה.
פירוק מגבלת המזומן, ההשוואות והצעד הבא · נתוני סיכום ארבע חלופות התמחור
נבדקו 576 צירופי הנחות במודל הקיים, עם אבטלה שמגיעה ל־20%. רק 202 מסלולים הושלמו; 144 נעצרו ממגבלת מימון ממשלתית ו־230 ממגבלת נזילות, הון או פדיון מניות בחברות. אלו גבולות המודל, לא הסתברויות למשבר.
במסלולים שהושלמו, צריכה שאינה דיור נשמרה מעל 90% מהבסיס בכל שנה ב־83 מקרים למאבדי עבודה ללא חוב צרכני וב־75 למאבדי עבודה עם חוב צרכני. הקבוצות עשויות לשאת משכנתה. רק 42 זוגות תרחיש וביקורת הושלמו; בשתי קבוצות מאבדי העבודה הצריכה בסוף התקופה נמוכה מהביקורת. אין להסיק מכך על המסלולים שנקטעו.
הסף יחסי לצריכת ההתחלה של כל קבוצה, ואינו תקן לרמת חיים. התוצאות הן סימולציה בהנחות סוגנניות, ללא כיול. ירידת מחירים לבדה אינה מבטיחה שמירת צריכה במודל הזה.
הטבלאות, תנאי המימון ומגבלות ההשוואה · נתוני הסיכום ורשת ההנחות
הוכנה טיוטת פנייה להגדרת שאלת המחקר ודרישות ההיתכנות. עדכון שלב 104: לאחר מכן נשלחה פנייה, ולפי תשובת הספק שדווחה לחוקר מסלול הגישה הנוכחי אינו זמין. לא התקבלו נתוני משתתפים. המסמך נשמר כתיעוד היסטורי עם הודעת מצב מעודכנת.
נמצאו בשאלונים חודשיים שדות לסיבת שינוי בתעסוקה ולמועדו. טרם הוכחה חפיפה עם חשבונות UASFin פעילים ונתונים מלאים לפני ואחרי האירוע. מספר משלימי שאלון אינו מספר משקי בית מקושרים. המקור הוא מועמד מותנה; אין אמידה חדשה או כיול.
נבדקו UASFin, מסלול שיתוף מחקרי עם JPMorganChase Institute ונתוני Exact.One ששימשו מחקר בריטי. טרם אומתו גישה עבור המחקר, מספר אירועים מתאימים או כיסוי משקי הבית. ההמלצה היא לבדוק מקור קיים לפני הקמת פאנל חדש. אין אמידה או כיול חדשים.
התיעוד שנבדק אינו מבסס את השילוב הדרוש של הוצאות מזון חודשיות מתוארכות, מועד וסיבה לאובדן עבודה ונזילות סמוכה שקדמה לאירוע. אין אמידה חדשה או כיול. הוגדרו דרישות לבדיקת היתכנות של פאנל חודשי עתידי או מקור נתונים מקביל.
הבדיקה הקודמת אינה מכריעה. הוגדרו מראש מדדי הוצאה, דרישות דיוק ותנאי עצירה. אימות PSID העלה כי דיווח על שבוע ממוצע אינו מאפשר בדיקה חודשית של שלושה חודשים לפני ואחרי אובדן עבודה. טרם בוצעה אמידה חדשה או כיול.
תכנון הבדיקה · מיפוי המשתנים ומגבלות התזמון · 12 תרחישי גודל מדגם — הנחות תכנון בלבד
Inconclusive results · these data have not yet been used to calibrate the liquidity mechanism
Hypothesis 1: liquidity before job loss reduces the increase in economic hardship, conditional on similar initial income and wealth.
Hypothesis 2: debt-payment burdens before job loss amplify the impact, even after accounting for liquidity.
SIPP data for 2021–2024 were analyzed. The measured outcome is food insecurity, not consumption expenditure.
The new replication sample is too small: 1,050 participants and 22 job separations; no effect estimate was calculated.
The broader follow-up included 2,472 participants and 62 job separations. The estimate was −6.06 percentage points, with a 95% confidence interval from −23.33 to +11.22.
This follow-up includes overlapping participants and is not an independent replication. There is still no stable empirical support for the liquidity hypothesis.
PSID is not used in this study because its terms restrict the use of data with AI.
Historical extension: 11,253 potentially eligible participants and 468 job separations across five origin panels, with no duplicate participant IDs.
The household sample includes 4,527 households with consistent coding of the food-security measure in both periods; 322 were exposed to a household member’s job separation.
The SIPP household-level test provided no clear support for the hypothesis that liquidity before job separation protects against deterioration in food security.
The strict sample included 4,527 households; a sensitivity analysis allowing composition changes in the outcome year included 5,128. Both estimates were in the opposite direction to the hypothesis, but their uncertainty intervals included zero. Calibration remains unchanged.
The SHED extension examined 2,562 unique respondents across two follow-up windows, including 168 who reported job loss. Each respondent contributed only one window.
The primary estimate was in the hypothesized direction, but its uncertainty interval included zero. The estimate changed when a later window was selected, and no analysis met the precision target. Calibration remains unchanged.
SHED extension report without duplicate respondents (English)
The initial SHED check included 1,807 respondents, of whom 132 reported job loss.
The estimated association was in the hypothesized direction, but its uncertainty interval included zero and precision fell short of the target. The measures differ from SIPP, so this does not confirm the thesis or justify recalibration.
SHED external-source check report (English)
Exploratory test and sensitivity analysis report (English)
Precision scenarios and sample-selection report (English)
Household and food-security measure validation report (English)
Sample expansion and precision-planning report (English) · Replication and follow-up report (English) · Aggregate results data · Original study protocol (English)
Automation replaces human labor and raises productivity. If cost savings lower goods/services prices, basic nominal income may buy a substantial basket. Outcomes depend on redistribution of capital returns, ownership concentration and real debt burdens.
The hypothesis is that asset owners without debt have a structural advantage at transition. Leveraged households may suffer debt deflation even as consumer prices fall.
Output with automation-dependent productivity:
Price level when automation reduces costs:
Basic per-person transfer from profit taxation:
Schematic real household consumption:
How worker replacement affects output, prices and labor and capital income shares.
How lower prices increase the real value of nominal debt and can trigger asset sales, default and bank losses.
Compare concentrated capital, broad pension saving and public ownership of automated assets.
Long-term models of inheritance, inheritance taxes, capital accumulation and differences between groups.
Earlier simulations examined concentrated ownership, broad pension ownership, refinancing, inheritance and taxation. Broader ownership may raise workers' capital-income and consumption shares, while nominal debt can weigh more heavily as prices fall.
Results depend on model assumptions. They neither establish real-world causality nor validate forecasts of 20% unemployment.
The baseline model shows economic mechanisms and parameter sensitivity. Further work requires data calibration, out-of-sample tests, alternative-model comparison and separation of policy scenarios from forecasts.
Source: thesis and models developed in research discussions on automation, unemployment, deflation, capital distribution and debt. This page summarizes central ideas and equations, not every earlier experiment file.
Reproducible World Bank pipeline: fetch data, document sources, check completeness and estimate country/year fixed effects. Run scripts in calibration/ on a server with internet access.
Status: Observed data were not fetched in the build environment. Corporate, capital and automation tax elasticities are not yet validly calibrated. See CALIBRATION_V32.md.
Import estimates from JSON built from verified country-year data. No observed estimates appear until data have actually been fetched and estimated.
No data file loaded yet.
Coefficients are not automatically applied to tax optimization. Statistical association is not causation. See CALIBRATION_V33.md.
Load CSV data from official sources. Browser checks are preliminary; the Python script audits SHA-256, duplicates, ranges and metadata in detail.
No file loaded yet.
The file contains no actual tax data. Tax revenue/output is not an effective rate, and robot counts cannot substitute for an automation-tax base.
Descriptive debt/output, corporate-tax revenue/output, capital income tax revenue/output, transfers/output and unemployment. Compare overlapping years only, without filling missing data. Use verified files from official sources before analysis.
Run python calibration/israel_oecd.py your_verified_panel.csv --peers DEU,FRA,GBR,USA --out israel_comparison.json then load the results file:
No results file loaded yet.
No complete official panel or estimated elasticities yet. Descriptive comparison does not identify causality; tax receipts are not a tax base.
Four observations from OECD Revenue Statistics 2024 Table 4.35, without filling or forecasting missing years. Partial data, not a calibrated panel.
Source: OECD, Table 4.35. Data do not separately include capital income taxation, benefits or an automation-tax base; they cannot establish elasticities or benefit-funding capacity.
Seven observations from OECD tables, 2000–2022, combine editions and identify each publication year. Neither a continuous annual series nor an elasticity calibration.
Statutory corporate-tax rates are excluded because a matching annual series is unverified. Revenue divided by a tax rate is not a valid unadjusted tax base.
Controlled merger of Israel series, 2000–2025. Load JSON generated with calibration/israel_harmonize_v38.py from CSV files with explicit sources. The engine does not fetch data, fill missing years or calculate tax elasticities automatically.
A statutory tax rate is not an effective rate; tax revenue/output is not a tax base. See ISRAEL_HARMONIZED_V38.md.
9 of 26 years (2000–2025): Israel corporate-tax revenue, OECD, current billion ₪. Mixed publication editions do not form a consistent series for causal calibration.
Full data and sources: Validated CSV · Coverage report
| Year | Corporate tax (billion ₪) | Corporate tax/output (%) | OECD edition |
|---|---|---|---|
| 2000 | 18.0 | 3.2% | 2024 |
| 2010 | 23.1 | 2.6% | 2024 |
| 2016 | 37.8 | 3.1% | 2019 |
| 2017 | 41.9 | 3.3% | 2020 |
| 2018 | 42.9 | 3.2% | 2021 |
| 2019 | 43.3 | 3.1% | 2021 |
| 2020 | 39.0 | 2.8% | 2023 |
| 2021 | 56.5 | 3.5% | 2024 |
| 2022 | 76.2 | 4.3% | 2024 |
Warning: A tax/output ratio is not a statutory or effective tax rate. It does not identify a tax elasticity or causal effect.
OECD/World Bank series-ingestion infrastructure checks classification, sources and year coverage. Live retrieval is incomplete; no complete empirical-calibration panel is available.
Panel files, verification report and import instructions are included in the project download.
2015–2024 OECD Data Explorer, classification 1200, central government: current million ₪ converted to billions. Manually transcribed from the official table, not fetched by API. Values differing from earlier editions were not mixed.
OECD Data Explorer · No matching output series or verified tax rates yet. Elasticities are not calibrated and no causal effect is identified.
Corporate tax: OECD classification 1200, central government. Nominal output: World Bank WDI values rounded to billion ₪, reproduced by a secondary website and not verified through direct API retrieval. The tax rates are general statutory rates, not effective rates.
Research limitation: Only ten years and three statutory tax levels, with policy changes, time trends and shocks. Correlation is not causality or a tax-base elasticity. Verify output directly against WDI before calibration.
World Bank/OECD ingestion and audit for ten countries, checking sources, units, dimensions, duplicates and missing years.
Research status: No new official data were downloaded in this version. The historical Israel panel remains descriptive and requires direct verification; no calibrated tax elasticity or verified OECD empirical panel yet.
Primary-source verification for Israel output, 2015–2024. Previous output values remain secondary-source observations and must not support empirical calibration.
Status: Direct API retrieval remains incomplete because of build-environment network restrictions. The code can run online, storing source files and SHA-256 fingerprints after validation.
V45 verification guide · Output observations from a secondary source — not directly verified